Sunday, February 15, 2026
UK Average Net Worth by Age 2026: ONS Median Figures
One of the most common questions people have when they start tracking their finances is: where should I be by now? It's natural to want a benchmark. But finding reliable UK-specific data isn't always straightforward.
Here's what the numbers actually say, where they come from, and why you should take them with a generous pinch of salt.
The data: ONS Wealth and Assets Survey
The best source of UK household wealth data is the Office for National Statistics (ONS) Wealth and Assets Survey (WAS). The most recent full release is Round 8, covering April 2020 to March 2022, published in January 2025.
This survey measures total household wealth, which includes:
- Property wealth (net of mortgage)
- Financial wealth (savings, investments, ISAs)
- Private pension wealth (defined benefit and defined contribution)
- Physical wealth (vehicles, valuables, contents)
It does not include state pension entitlement, which would significantly increase figures for older age groups.
Median total wealth by age of household head
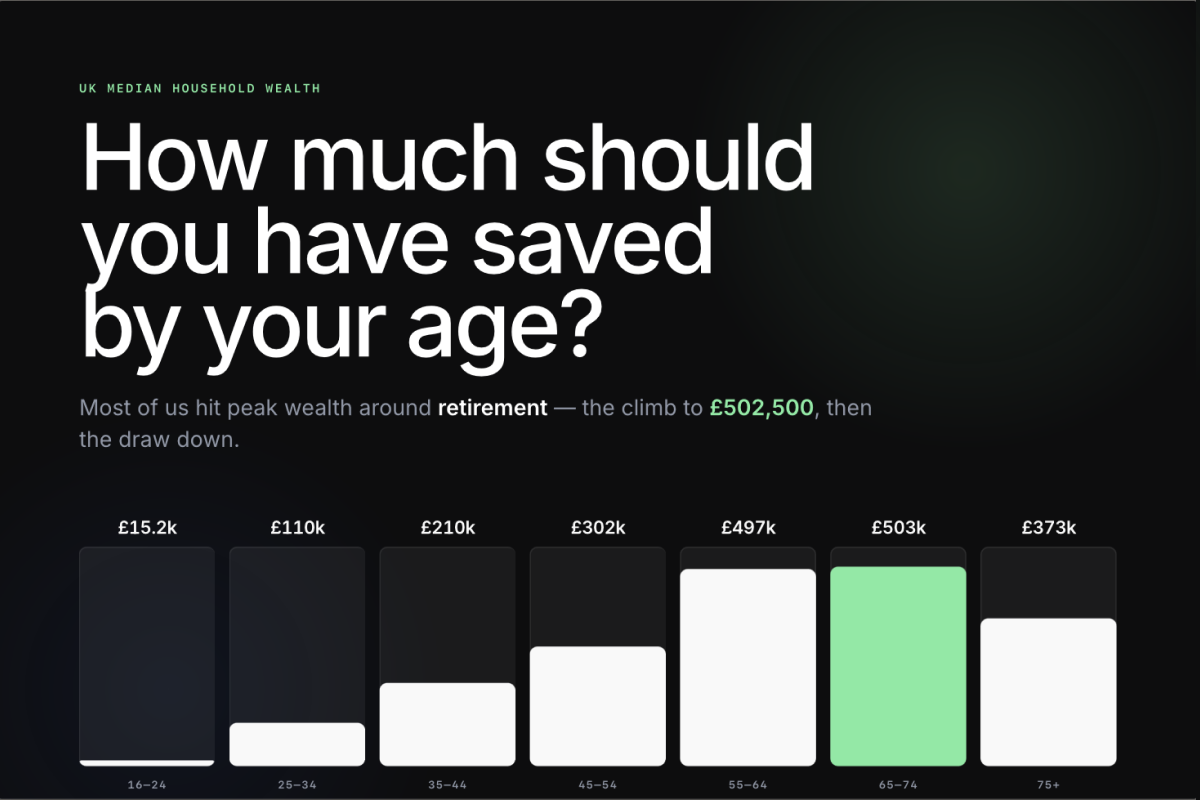
Here are the median (middle) figures from the ONS WAS Round 8:
| Age group | Median total household wealth |
|---|---|
| 16-24 | £15,200 |
| 25-34 | £109,800 |
| 35-44 | £209,600 |
| 45-54 | £301,900 |
| 55-64 | £496,500 |
| 65-74 | £502,500 |
| 75+ | £373,100 |
Source: ONS Wealth and Assets Survey Round 8, April 2020 to March 2022. Published January 2025.
A few things jump out immediately.
Why these numbers might surprise you
They're household figures, not individual
If you live with a partner and you both work, your household wealth includes both of your pensions, savings, and your shared property equity. A single person comparing their individual net worth to these household figures will naturally come in lower. The ONS doesn't publish a clean individual breakdown, so keep this in mind.
Pensions are the biggest component
For most age groups, private pension wealth makes up the largest share of total wealth. Someone aged 55-64 with a median total wealth of £496,500 might have £250,000 or more of that locked in pensions they can't access yet.
This matters because pension wealth feels very different from money in your bank account. You can't spend it now, and for defined benefit schemes, the "value" is an actuarial estimate rather than a pot of money you can see.
For the individual-level pension figures — including the median pension wealth for each age band from the same ONS survey — see our companion guide to average pension wealth by age in the UK.
Property skews everything
The UK's housing market means that property wealth dominates the picture for homeowners, while renters have dramatically lower total wealth. According to the same ONS data, the median wealth for homeowners was around £425,000, compared to just £15,400 for private renters.
Where you live and whether you own property will have a bigger impact on your net worth than almost any other single factor.
The 75+ drop-off
Total wealth peaks in the 65-74 bracket and then falls. This is normal — retirees are drawing down savings and pensions to fund living costs. It doesn't mean people are getting poorer; it means they're spending the wealth they accumulated during their working lives.
How does the UK compare to other countries?
The Resolution Foundation's "Wealth Check" report (July 2024) provides useful context. The UK has relatively high household wealth compared to many European countries, largely driven by property values and the private pension system. However, wealth inequality in the UK is significant — the wealthiest 10% of households hold around 43% of all wealth, while the bottom half hold less than 9%.
The House of Commons Library briefing on household wealth (CBP-10210, updated November 2025) notes that wealth inequality has remained broadly stable over the last decade, with property and pension wealth being the primary drivers of the gap.
Why averages can be misleading
You'll sometimes see mean (average) wealth figures quoted, which are much higher than the medians above. For example, mean household wealth across all age groups was over £500,000 in the latest data. But this is skewed heavily by a small number of very wealthy households. The median — the midpoint where half of households are above and half below — is a much more useful benchmark for most people.
What the generational data shows
Research from the Institute for Fiscal Studies (IFS) has tracked wealth across generations and found that younger cohorts are accumulating less housing wealth at the same age than older generations did. Millennials (born 1981-2000) are less likely to own property by their early 30s than Generation X were at the same age, largely due to rising house prices relative to earnings.
On the other hand, workplace auto-enrolment (introduced in 2012) means younger workers are more likely to have a pension than previous generations were at the same age, even if the pots are still relatively small.
So how should you use these numbers?
As a rough compass, not a scorecard
If you're 35 and your household net worth is £150,000, you're below the median — but you might be in an expensive rental area where buying isn't realistic, and you might have a solid pension building in the background. Context matters enormously.
Focus on the trend, not the snapshot
Whether you're above or below the median matters much less than whether your net worth is growing over time. Someone at £100,000 and climbing steadily is in a better position than someone at £300,000 and stagnant or declining.
Break it down by component
Understanding where your wealth sits is more useful than just knowing the total. Key questions:
- How much is in pensions? Can you access it, and is it growing?
- How much is property equity? Are you building equity through mortgage repayments?
- How much is liquid? Could you cover an emergency without borrowing?
- How much debt do you have? Is it shrinking?
Don't compare to social media
The numbers above are from a rigorous national survey of 20,000+ households. They're far more reliable than anything you'll see on Reddit, TikTok, or personal finance forums, where selection bias means you're mostly hearing from people who are either doing unusually well or unusually badly.
The bottom line
For most people in the UK, total household wealth (including pensions and property) breaks down roughly like this:
- In your 20s: Building from near zero. Focus on avoiding bad debt and starting a pension.
- In your 30s: The gap between homeowners and renters starts to widen. Property equity and growing pension pots are the main drivers.
- In your 40s-50s: Peak earning years. Wealth accelerates for those paying down mortgages and building investment portfolios.
- In your 60s-70s: Wealth peaks as mortgages are cleared and pensions reach maturity.
- 75+: Gradual drawdown begins.
The single most useful thing you can do is start tracking where you are now and check in regularly. Knowing your number — even if it's not where you want it to be — is the first step to improving it. If you've never worked yours out, our guide to how to calculate your net worth walks through it step by step.
Sources:
- Office for National Statistics, Wealth and Assets Survey Round 8, April 2020 to March 2022 (published January 2025)
- Resolution Foundation, Wealth Check, July 2024
- Institute for Fiscal Studies, generational wealth research
- House of Commons Library, Household Wealth briefing CBP-10210, November 2025
Want to see where you stand? Aureli lets you track all your assets, debts, pensions, and property in one place — free to get started.